Southwark Planning Applications
Review Southwark planning permission trends by ward, including applications, approval rate and average weeks to decision.
Southwark Planning Trends
Southwark recorded 5,370 planning applications in this London planning dataset, including 4,364 applications with an approval or refusal decision. Its approval rate is 94.4%, 9.1 percentage points above the London average (higher than average).
Approved applications in Southwark took 8.1 weeks on average. That is 0.8 weeks below the London average (faster than average). The ward with the most applications in this dataset is DUVI, with 599 applications.
Total decisions
4,364
Approval rate
94.4%
Weeks to decision
8.1
| Southwark total | 4,364 | 94.4% 94.4% | 8.1 | |
| NBER | 158 | 99.4% 99.4% | 10.7 | |
| SUDO | 100 | 98.0% 98.0% | 6.8 | |
| DUWO | 270 | 97.8% 97.8% | 5.6 | |
| DUVI | 524 | 97.1% 97.1% | 6.2 | |
| OLKE | 274 | 97.1% 97.1% | 10.5 | |
| ROTH | 93 | 96.8% 96.8% | 8.1 | |
| DULH | 147 | 95.9% 95.9% | 7.9 | |
| CHHI | 156 | 95.5% 95.5% | 6.9 | |
| GOGR | 286 | 95.5% 95.5% | 7.4 | |
| SOMB | 132 | 94.7% 94.7% | 7.8 | |
| PERY | 151 | 94.0% 94.0% | 6.4 | |
| SGEO | 84 | 94.0% 94.0% | 9.9 | |
| LBWB | 342 | 93.6% 93.6% | 9.0 | |
| PECM | 47 | 93.6% 93.6% | 9.4 | |
| RYLA | 244 | 93.4% 93.4% | 7.4 | |
| BOBA | 321 | 92.2% 92.2% | 11.4 | |
| SGIL | 249 | 91.6% 91.6% | 7.5 | |
| FARA | 80 | 91.3% 91.3% | 9.6 | |
| NWAL | 216 | 91.2% 91.2% | 9.4 | |
| CAGR | 172 | 90.7% 90.7% | 7.8 | |
| NUQU | 129 | 90.7% 90.7% | 8.0 | |
| CHAU | 124 | 89.5% 89.5% | 8.7 | |
| NWNG | 62 | 88.7% 88.7% | 6.7 |
Source: Planning London Datahub. Data covers period April 2025 to July 2026. Approval rate excludes applications still awaiting a decision.
Check planning applications near a specific property
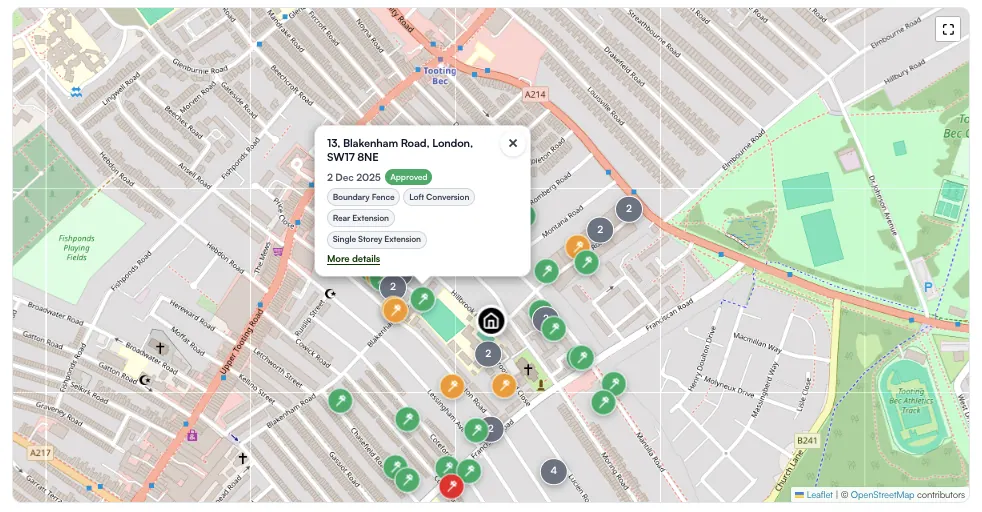
Enter a London postcode, select the address, and open the property report to see nearby planning applications plotted on a map. The report shows application status, proposal details, dates, council records where available, and the planning type such as rear extension, loft conversion, boundary fence or other residential works.
Got Questions?
Planning London Datahub. This is a publicly accessible database that brings together planning application and development proposal data from all London Planning Authorities. Data covers period April 2025 to July 2026. See FAQ below for further detail on methodology.
At the moment, this tool only covers London because London has a central planning dataset: the Planning London Datahub. It brings together planning application and development data from London planning authorities in one structured, publicly accessible place. Outside London, planning data is usually spread across hundreds of separate council portals. The only way to obtain this data would be to scrape these portals which can be a legally grey area. So for now, we use official bulk-access data where it is available. We may expand beyond London if more councils provide reliable public downloads or APIs.
Enter a Greater London postcode, select the property address, and open the free property report. The report shows nearby planning applications, decisions, dates, categories and a map where coordinates are available.
Time to approval is the average time between a valid planning application date and the decision date for applications that were approved or granted. Pending applications are not included in this timing measure.
Approval rate is calculated from decided applications only: approved or granted applications divided by approved plus refused applications. Applications still awaiting a decision are excluded.
We use a mix of structured fields from the Planning London Datahub and keyword matching on the application description. One application can have more than one tag. For example, a single-storey rear extension may be tagged as both single_storey and rear_extension. The tags are designed to be directional, not perfect. They help group similar applications, but they may not capture every detail. Where possible, you should review the original council planning record before relying on the information.