Crime Checker by Postcode

Enter a postcode to see how many crimes are reported nearby, how that compares to your local authority average, and the main areas where incidents are concentrated - shown on a map.

FreeNo sign upMap view
Police.uk dataset refreshed on

What this crime checker shows

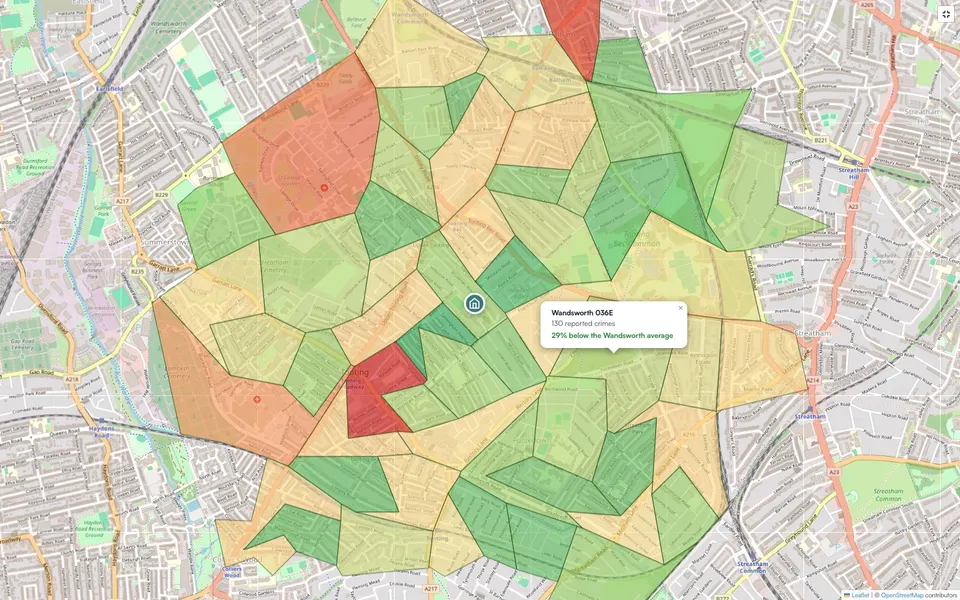
Enter a UK postcode and we'll show you how many crimes were reported within roughly 1 mile of that location, and whether that's above or below the average for your local authority. The main areas where crimes are concentrated are shown on a map, using official Police.uk data. It's free and no sign up is needed.

Crime heatmap for a UK postcode, showing reported-crime hotspot areas in colour around a central property pin, with a tooltip showing the crime count and local authority comparison.
Crime map showing reported incidents within 1 mile of a postcode, with hotspot areas highlighted. Enter a postcode above to see the real data for any area.

What the crime checker shows

The tool gives you four things for any postcode in England, Wales or Northern Ireland:

  • Total reported crimes nearby

    The number of crimes reported within roughly 1 mile of the postcode.

  • Compared to the local authority average

    Whether that count is above or below the average for your local authority area.

  • Where crimes are concentrated

    A map showing the main areas where crimes are reported as hotspots.

  • Most recent data available

    The latest month of Police.uk data published for the area.

To protect victims' privacy, Police.uk does not publish the exact address of each crime. Every report is mapped to an anonymous point nearby, such as a street or junction, so a marker shows roughly where crimes were reported rather than a specific house.

Does a higher crime count mean an area is unsafe?

Not on its own. Busy areas with shops, stations and nightlife naturally record more incidents than quiet residential streets, simply because more people pass through. The comparison to the local authority average gives useful context - an area with more crimes than the local authority average in a generally low-crime district tells a different story to the same count in a busy city centre.

Why buyers check crime before viewing

Checking reported crime is a sensible step before you book a viewing or make an offer, alongside sold prices and the local schools. Seeing how a postcode compares to the local authority average helps you understand an area's character and gives you specific questions to ask the agent or neighbours. Enter a postcode to see the picture for any area, then open a free property report for the full detail.

Got Questions?

Enter a UK postcode into the search box above. You will see the total number of crimes reported within about 1 mile of that postcode, how that compares to the local authority average, and the main areas where crimes are concentrated shown on a map. It is free and no sign up is required.

All crime data comes from Police.uk (data.police.uk), the official Home Office service that publishes street-level crime and anti-social behaviour reports from police forces across England, Wales and Northern Ireland. It is updated monthly.

Police.uk publishes street-level crime data monthly, usually with a lag of a month or two. The map shows the most recent months available for the area, so the very latest weeks of activity may not appear yet.

Yes. Enter a postcode and the tool shows reported crime around that location on a map, grouped into hotspots so you can see where incidents are concentrated. The exact street-level points are anonymised by the police to protect privacy, so locations are snapped to nearby points rather than to a specific address.

To protect victims' privacy, Police.uk does not publish the precise address of each crime. Instead, every report is mapped to an anonymous 'snap point' nearby, such as a street, junction or public place. This means a marker shows roughly where crimes were reported, not the specific house involved.

No. The tool shows the total number of reported crimes within about 1 mile of the postcode and how that compares to the local authority average. It does not break the total down by crime type. For a full breakdown by category, you can visit data.police.uk directly.

Not necessarily. Busy areas with shops, stations and nightlife naturally record more incidents than quiet residential streets, simply because more people pass through. It is worth comparing a location against the wider neighbourhood and local authority average, and visiting at different times of day, rather than relying on a single number.

Yes. Checking reported crime is a sensible step before viewing or making an offer, alongside sold prices and the local schools. It helps you understand an area's character and ask the right questions. Combine it with a house value calculator by postcode to build a fuller picture before you commit. house value calculator by postcode

Police.uk covers police forces in England, Wales and Northern Ireland. Police Scotland does not publish street-level data to Police.uk, so crime is not available for Scottish postcodes through this tool.